CrediBook
A financial management app aims to help small and medium-sized businesses in Indonesia.
OVERVIEW
Many medium-sized entrepreneurs and individual businesses in Indonesia still record their finances manually. This leaves them vulnerable to losing information and being disorganized. Moreover, Indonesian culture adheres to a kinship system, which causes business owners and individuals to hesitate when collecting a debt.
Therefore, CrediBook provides a solution to these problems through financial transparency and digital records.
CrediBook helps individuals and small businesses keep track of their finances and manage them efficiently.
One of the features we focused on was transactions (Income-Expense). The purpose of this feature is to assist users in tracking their income and expenses. The transactions are tied to their debt balance (if any).
ROLE
Product Designer
User Interface Design, User Experience Design, Competitive Analysis, Interaction, Prototyping
July 2020 – September 2020
TEAM
1 Designer, 1 Graphic Designer, 1 Project Manager, 1 Backend Engineer (CTO), 1 Chief Operating Officer (COO), 2 Frontend Engineers
TOOLS
Figma, Google Docs, Figma Mirror, Zoom, Slack, Asana, Whimsical
Background
In February 2020, CrediBook launched an app for small and medium-sized companies that helps manage and track money owed through a digital ledger. Transactions involving receipts, expenses, and debt are stored on the platform. Users can send bills via SMS or WhatsApp. They can also receive debt payments directly from CrediBook. Learn more about what CrediBook does.
CrediBook was the first winner of the digital hero program for micro, small and medium enterprises 2020 organized by Indonesia’s Ministry of Cooperatives and SMEs.
Amidst the government’s efforts to accelerate digital transformation or digitize MSMEs, CrediBook offers innovative ideas for solving problems and helping MSMEs in Indonesia, especially in the area of financial records. Read more about the digital hero of 2020.
I joined CrediBook as a sole Product Designer, supporting the design team for the mobile device user experience and interface. I successfully delivered 5 features, including Transactions (Income-Expense), Referral, Payment, Group Transactions, and Invoice.
Understanding The Problem
Financial management for micro, small and medium enterprises is one of the major challenges in Indonesia. It has been difficult for many Indonesian businesses to separate personal finances from business finances. Financial records are still maintained manually on paper. In accordance with a publication of the International Labour Organization 2019, SMEs also have to confront management issues, organizational issues, as well as non-financial issues like inadequate education, financial literacy, and training as well as a lack of understanding of finance.
As businesses are expected to make business decisions quickly and accurately in the digital age, effective management of financial data will help them make informed decisions.
The Product Solution
Our goal was to address the issues through four key areas:
- Users can view total transactions
- Users can create transactions (income or expenses)
- Overview of income and expense by categories is available to users
- Income statements can be downloaded by users
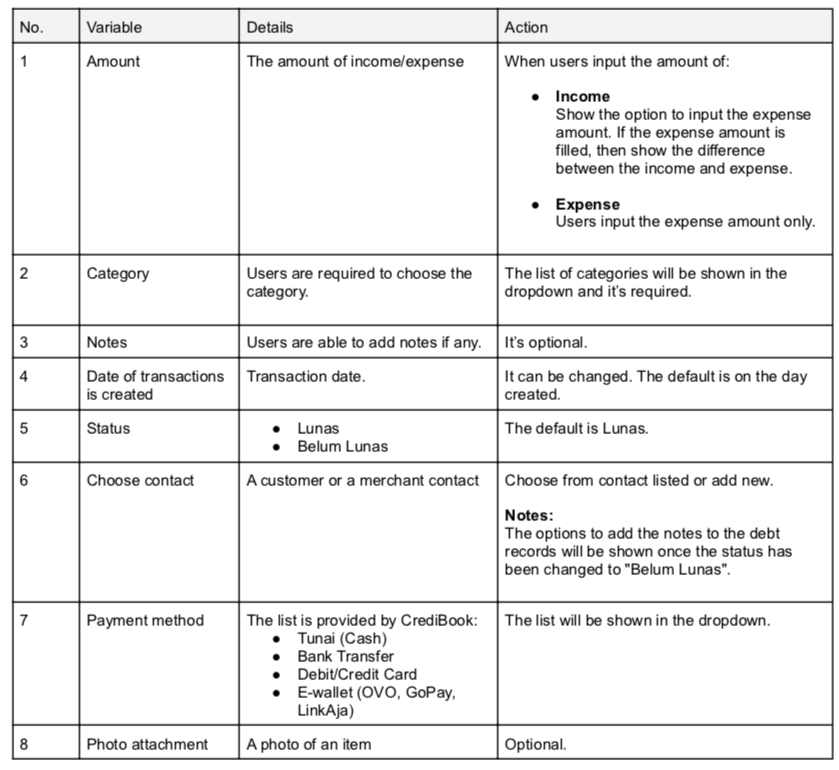
With these four key areas in mind, the Product Manager and I determined the following variables regarding the feature:
- Income. The amount of income created (indicator: green color).
- Expense. The amount of expense created (indicator: red color).
- Cashflow (profit/loss). The difference between the amount of income and expenditure.
- Date of transactions created. Transaction date.
- Status. Paid or unpaid.
- Contact Person. Customer or Merchant’s contact.
- Notes. Users are able to add a note regarding the transaction (if any).
- Payment method. The list is provided by CrediBook (Cash, Bank Transfer, Debit/Credit Card, E-wallet).
- Photo attachment. Users are able to upload a photo regarding the item transactions (if any).
- Track per category. A list of categories is provided by CrediBook such as transportation, leisure, basic needs, education, food and drink, etc.
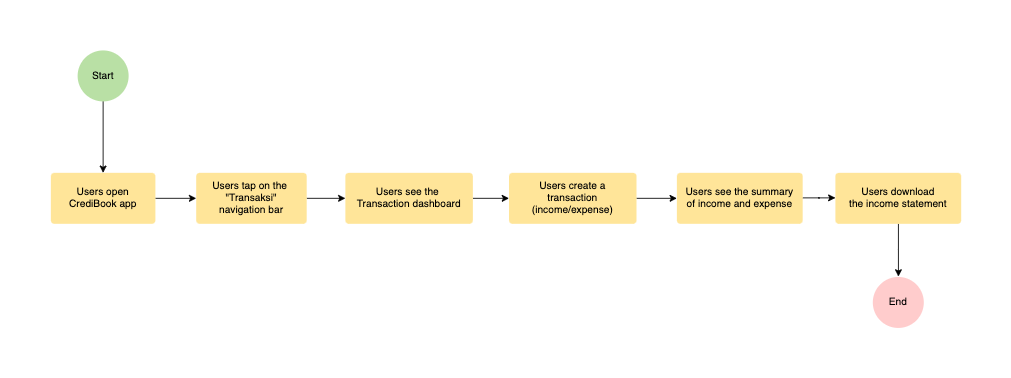
User Flow Chart
Product Specification
1. Transaction Dashboard

2. Transaction (Income-Expense)
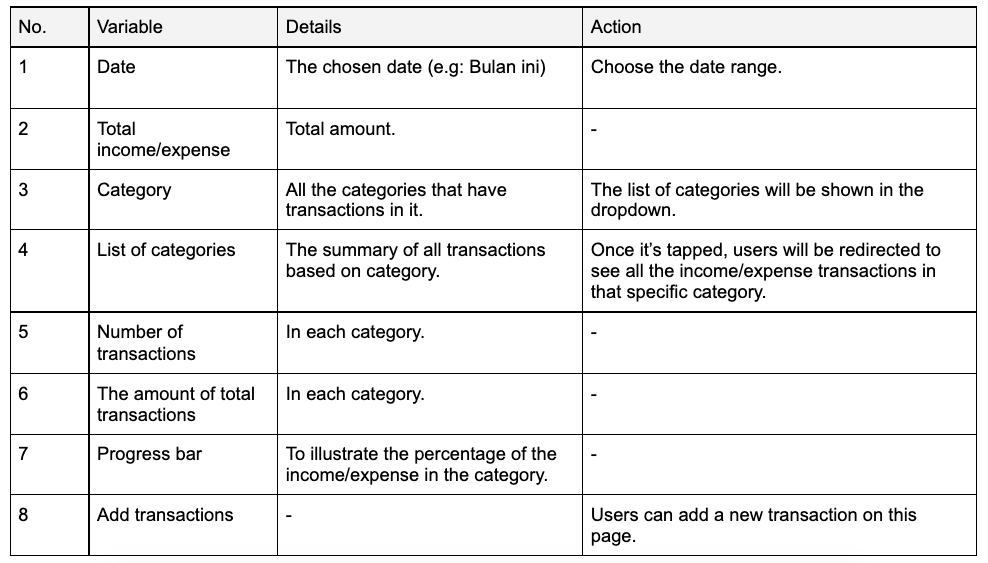
3. The summary of Income and Expense by Categories
Low Fidelity Wireframes
Based on product specs, I helped the Product Manager create wireframes for our four important focus areas.
First, users can view the transactions on the dashboard and the details associated with each transaction.


Second, users can create a transaction as an income (Pemasukan) or an expense (Pengeluaran).
In the dashboard, users tap the ‘Pemasukan’ button, then they will be redirected to the ‘add new income’ page. Users fill in their income, stock (if any), and other details. If they fill in their stock, the system automatically calculates their profit. Their profit is shown by the green bar and the transaction dashboard will update accordingly.

Third, users can view the summary of income and expense by category.
Users tap on ‘Pemasukan’ to view their incomes. To see historical information, users tap on one of the categories on the list.

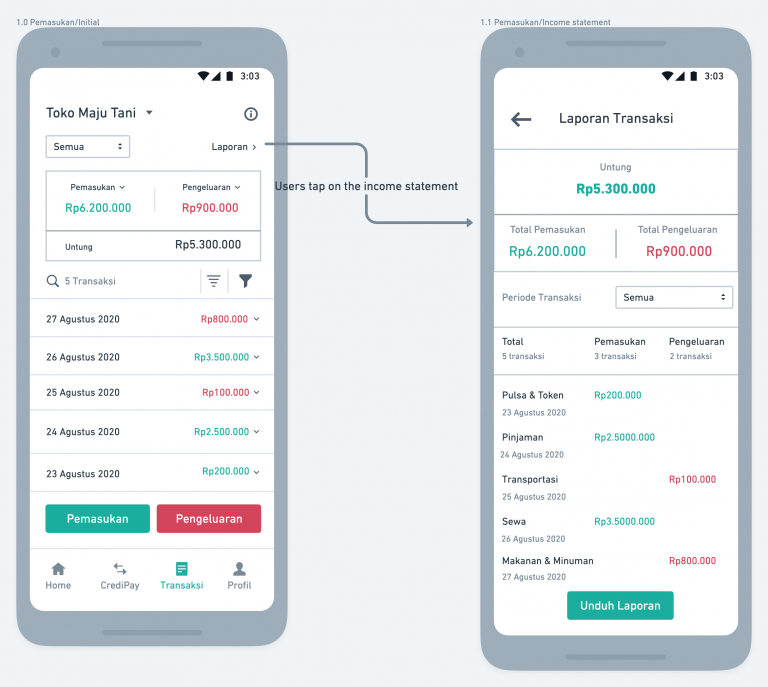
Fourth, users are able to download the income statement.
The income statement can be viewed by tapping ‘Laporan’. The user then taps on the ‘Unduh Laporan’ button to download the income statement.
High Fidelity Mockup and Prototype
I created the high fidelity mockup and tested it on Figma Mirror after collecting feedback from the Product Manager and the developers during the internal user testing (dogfooding). Our goal is to get qualitative feedback quickly.
The user flow of adding income
The interactions of adding income and profit case

The interactions of adding income and loss case

The interactions of adding expense

The user flow of viewing the income and expense by category

The user flow of viewing and downloading the income statement
Once users tap on the report, they can view the income statement report and download it.
The report format is in pdf as you can see in the right picture.


Takeaways
Since the implementation of this feature, we have received some improvement requests and positive feedback from users in Google Play Store. However, our primary challenge is that many of our users are not tech-savvy. The Chief Operating Officer (COO) and I spent a lot of time discussing our target market and how they interact with technology. In his role, he visits kiosks and talks to sellers in order to get feedback on our product and find out what problems they have. Our collaboration as a team was key in helping me come up with the initial concept.
With this in mind, I came up with an intuitive and minimalistic design, containing only the necessary elements and interactions. The application is primarily written in the Indonesian language, with easy-to-understand and clear wording. Additionally, we use a few representative colors in this application in order to keep people engaged and to illustrate the difference between income (green color) and expenses (red color).
Last but not least, a constant iteration of the design is crucial to improving the user experience. It is important to listen to any feedback you receive from your users.